
RRB Group D Previous Year Cut Off: What the Last Cycle's Numbers Actually Say
RRB Group D Previous Year Cut Off: What the Last Cycle's Numbers Actually Say
32,438 vacancies. Result on 1 July 2026. Roughly 63,295 candidates called for the Physical Efficiency Test. Those three numbers from CEN 08/2024 are the closest thing a CEN 09/2025 candidate has to a reference point.
What follows is the zone wise and category wise cut off from that cycle, and an honest account of what it can and cannot tell you about this one. We have left out every figure we could not corroborate, because a half table of real numbers beats a full table of invented ones.
Looking for this cycle's cut-off? The CEN 09/2025 cut-off comes with the result in October 2026 — see our [RRB Group D cut off 2026 guide]. This page covers the historical trend across past cycles.
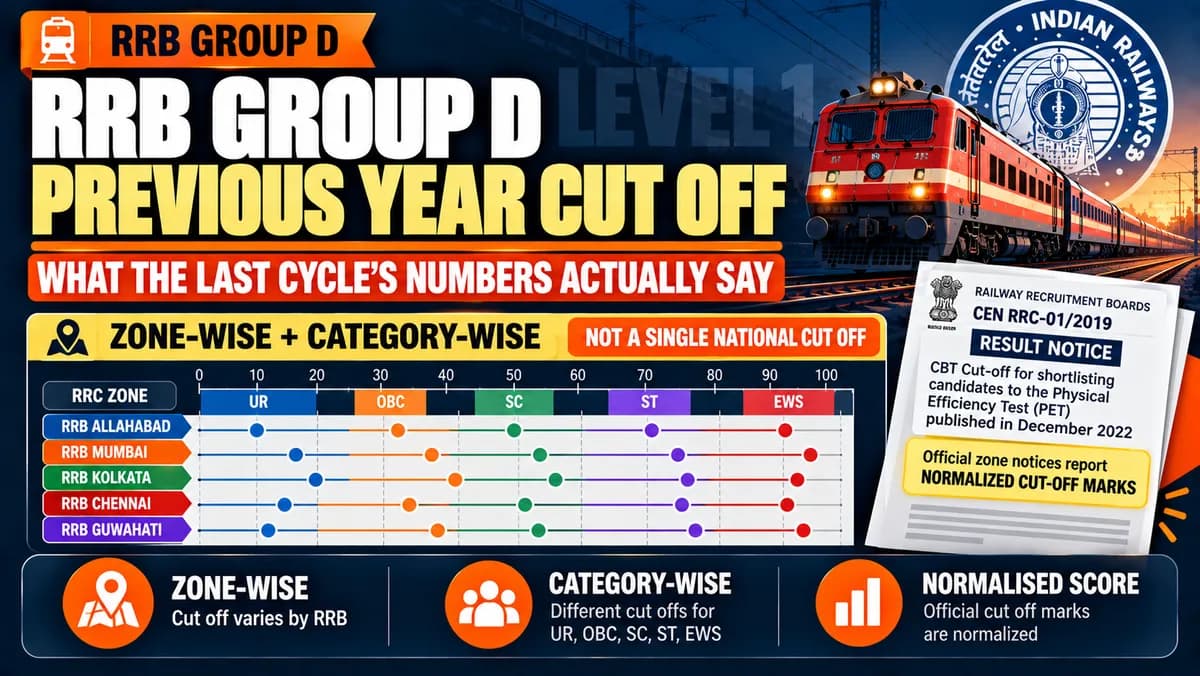
CEN 08/2024 zone wise and category wise cut off
These are normalised scores, not raw marks. On a 100 mark paper a normalised figure can sit above or below what you actually scored, for the reasons set out in our normalisation explainer.
Two notes on the table. The OBC figure for Ajmer was not available in the sources we checked, so it is left blank rather than filled with a guess. The Ajmer ST figure also varies between published listings, so treat it as indicative and confirm it on the RRB Ajmer result PDF.
Everything above is transcribed from the zone wise CEN 08/2024 result documents as published. Before you rely on any single number, open your own RRB's result PDF and read it there.
What the spread between zones tells you
Look at the UR column from top to bottom. Kolkata sat at 80.23. Bengaluru sat at 70.29. That is a gap of almost exactly 10 marks for the same recruitment, the same paper standard, and the same national vacancy pool.
The zones that ran high were largely the ones with dense Level 1 demand against a modest vacancy share. The zones that ran lower had a friendlier ratio of candidates to seats.
This is the single most useful thing in the table. Not the exact number, but the fact that your zone's position in this ranking tends to persist, because the underlying population and vacancy pattern does not change much in one cycle.
The category columns are more interesting than the UR column
Compare Ranchi and Guwahati. Ranchi's UR was 72.86 and its SC figure was 58.94, a gap of nearly 14 marks. Guwahati's UR was 77.63 and its SC figure was 73.86, a gap of under 4 marks.
Same country, same exam, wildly different internal spreads. That difference comes from how many candidates of each category applied in that zone against the seats reserved for them.
So a candidate comparing their category cut off to a friend's in another zone is comparing two unrelated calculations. The only comparison that means anything is your category in your zone across cycles.
Vacancies went down. What does that do?
The vacancy count has dropped by roughly ten thousand posts between the two cycles. All else being equal, fewer seats means the line is drawn higher in the merit list.
All else is not equal, though. Candidate numbers, shift difficulty and normalisation all move independently, and any one of them can cancel out the vacancy effect. This is why we are not publishing a predicted figure for this cycle, and why you should distrust anyone who does. The four factors are broken down in our Group D cut off guide.
Reading the shortlist ratio properly
Last cycle, about 63,295 candidates were called for PET against 32,438 vacancies. That works out to roughly two candidates per seat.
RRBs are permitted to shortlist up to three times the community wise vacancies. So the previous cycle did not use the full allowance, which tells you the shortlist runs only as deep as the qualified pool in that zone allows.
Apply that shape, not that number, to 22,195 posts. Treating two candidates per seat as a rule rather than an observation is exactly the error that produces fake predictions.
Three zones worth studying if yours is one of them
Patna is the clearest case of a high demand zone. Its UR figure was 78.45 and its OBC figure 78.28, which is a gap of barely 0.17. When the general and OBC lines almost touch, it tells you the zone is saturated at the top and that reservation offers very little cushion there.
Ranchi shows the opposite pattern. UR at 72.86 against SC at 58.94 is one of the widest internal spreads in the table, which reflects a smaller candidate pool in some categories.
Kolkata simply ran the highest UR line in the country at 80.23, and candidates there should assume the competition stays tight this cycle too.
Older cycles, and why they are not in this article
You will find pages listing Group D cut offs going back several years, often with figures above 100 that are presented without explanation.
We could not verify those older zone wise figures against the original result documents, so they are not here. Some of them are real, some are recycled across sites with errors compounding each time, and none of them are worth planning around when the recruitment rules, vacancy counts and normalisation method have all changed in between.
An honest opinion. Anything older than one cycle has almost no predictive value for your zone. Use CEN 08/2024 as your reference and stop there.
How to use this table well
- Find your zone and your category. That single cell is your reference point. Ignore the rest of the table.
- Compare your own normalised score to it once the result is out, not your raw score to it now.
- Treat a gap of under five marks as uncertain in either direction, given the vacancy drop.
- Start physical preparation if you are anywhere near that cell. The stage sequence is laid out in our RRB Group D 2026 guide.
ExamAtlas practice sets report topic wise accuracy, which is a more honest signal about where you stand than any comparison with last year's cut off.
Frequently asked questions
What was the RRB Group D cut off in the last cycle?
For CEN 08/2024, published zone wise UR cut offs ranged from about 70.29 in Bengaluru to 80.23 in Kolkata on a normalised scale. Category cut offs were lower and varied widely by zone, from under 59 for SC in Ranchi to nearly 74 for SC in Guwahati.
Are these cut offs raw marks or normalised marks?
Normalised marks. Because the CBT is held across many shifts with different question sets, the merit list and the cut off are both built on normalised scores, not on your raw marks.
Will the CEN 09/2025 cut off be higher than CEN 08/2024?
Nobody can say. Vacancies have fallen from 32,438 to 22,195, which pushes the line up, but candidate numbers, shift difficulty and normalisation can all move it the other way. Any specific predicted number you see is a guess.
Why is the cut off so different between zones?
Each RRB prepares its own merit list against its own vacancies and its own candidate pool. Zones with more applicants per seat finish higher. The spread for UR in the last cycle was close to 10 marks between the highest and lowest zone.
How many candidates are called for the PET?
Up to three times the community wise vacancies, as a maximum. In CEN 08/2024 around 63,295 candidates were called against 32,438 vacancies, which is roughly two per seat, so the full allowance was not used.
Where can I check the official zone wise cut off PDF?
On your own regional RRB website, published alongside the result. The figures in this article are transcribed from those published zone wise documents and should be confirmed against your RRB's own PDF.
Final word
A caution worth repeating, because it will matter in a few weeks. The day the CEN 09/2025 result appears, prediction pages will quietly replace last cycle's numbers with new ones and present them as this cycle's cut off.
The only cut off that exists is the one your RRB publishes in its own result document. Until then, the table above is history, useful for orientation and useless as a target.